B. Life Systems · Interactions in the EnvironmentChanging a Food Chain: Ripple Effects and Biomagnification
B2.4 A2.1 A1.5 A3.3About 55 minutes
Learning goals- I can predict the effects of removing or adding a producer, consumer or predator in a food chain or web.
- I can explain a trophic cascade using a real Canadian example.
- I can explain how some toxic substances become more concentrated at each level of a food chain (biomagnification).
- I can plan and trace a simple program that models a change in a food chain.
Words to know
ripple effect
A chain of changes that spreads out from one change, like ripples from a stone dropped in water.
trophic cascade
A ripple effect that travels down a food chain when a top predator is removed or returns, changing the numbers of animals and plants below it.
keystone species
A species that has a much bigger effect on its ecosystem than its numbers suggest, so removing it changes the ecosystem a lot.
invasive species
A species that is brought to a new area, spreads quickly and harms the ecosystem, economy or people's health.
bioaccumulation
The build-up of a toxic substance inside one organism over its lifetime, because it takes the substance in faster than it gets rid of it.
biomagnification
The increase in concentration of a toxic substance at each higher trophic level in a food chain.
persistent
Describes a substance that breaks down very slowly, so it stays in the environment and in bodies for a long time.
Pull one thread
Imagine a knitted sweater. Pull one loose thread, and a whole row can come undone. Ecosystems can be like that. Removing one species, or adding a new one, can change many others, sometimes in surprising ways.
In the last lesson, you saw how energy moves up a food chain. Now you'll see what happens when a link in the chain changes.
Predicting the effects of a change
Use this chain: grass → hares → lynx.
- Remove the producer (grass, after a drought): hares have less food, so many starve or move away. Then lynx have less food, and their numbers fall too. A change at the bottom affects every level above it.
- Remove the primary consumer (hares, after a disease): grass grows more, because nothing is eating it. Lynx lose their food and decline or switch to other prey.
- Remove the top predator (lynx, by trapping): hares increase quickly. With too many hares, they overeat the plants, then many hares starve. The plants may take years to recover.
Real ecosystems are food webs, not single chains, so animals can often switch to other foods. The more connections, the smaller the ripple (you saw this as resilience in Grade 6).
A real trophic cascade: sea otters on the Pacific coast
Off the coast of British Columbia:
kelp (a large seaweed) → sea urchins → sea otters
- Sea otters eat sea urchins. Sea urchins eat kelp.
- Starting in the late 1700s, sea otters were hunted for their fur until, by the early 1900s, they had disappeared from British Columbia's coast.
- Without otters, sea urchin numbers grew. The urchins ate the kelp forests down to bare rock in many places. Fish and other animals that lived in the kelp lost their homes.
- In the late 1960s and early 1970s, sea otters were brought back from Alaska to the west coast of Vancouver Island. Where otters returned, urchins decreased, and kelp forests grew back.
A change at the top of the chain cascaded down to the producers. Sea otters are called a keystone species.
Coastal First Nations, whose ancestors harvested both sea otters and shellfish, have shared knowledge about how otters affect shellfish such as clams and urchins. The otters' return brought back kelp, but also meant competition for shellfish that are important foods for these communities. Scientists and First Nations work together to understand these changes.
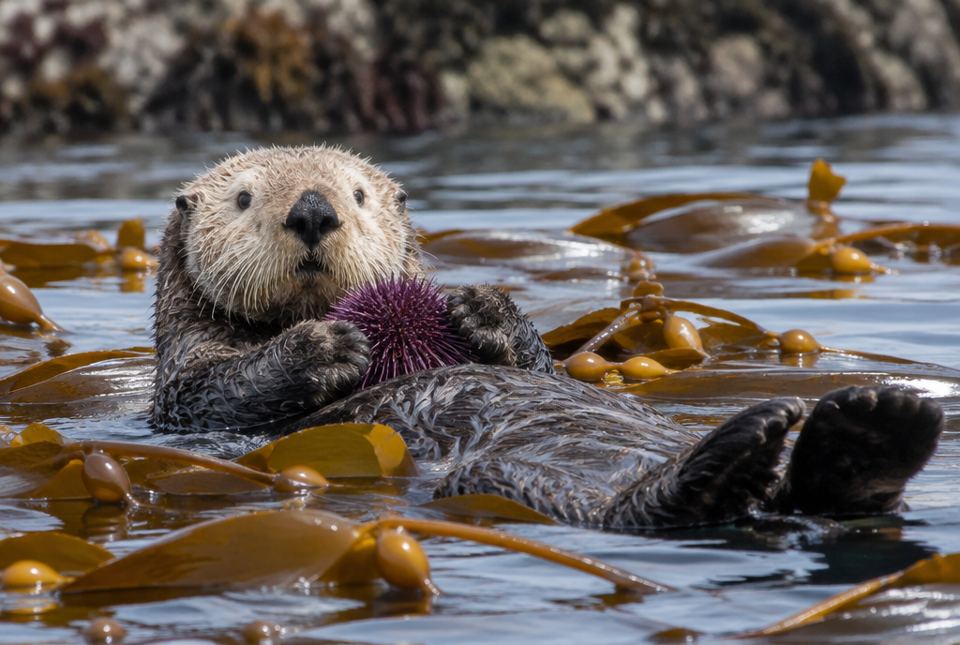 Sea otters eat sea urchins. With otters around, fewer urchins graze on kelp, so kelp forests can grow back. AI-generated imageA trophic cascade on the B.C. coast. Without otters, urchins multiplied and ate the kelp down to bare rock. Where otters returned, urchin numbers fell and kelp forests grew back.
Adding a species: the sea lamprey
Adding a species can change a food chain too. The sea lamprey is an eel-like fish that attaches to other fish with a sucking mouth full of teeth and feeds on their blood and body fluids. It is not native to the upper Great Lakes. It spread there through shipping canals in the early 1900s.
In the mid-1900s, sea lampreys helped cause a huge drop in lake trout, a top predator fish in the Great Lakes. Canada and the United States now control lampreys together, using barriers on streams, traps and a chemical (a lampricide) that targets young lampreys in the streams where they hatch. Lake trout numbers have recovered in some areas.
When poisons climb the food chain
Some toxic substances, like the pesticide DDT, the metal mercury and chemicals called PCBs, are persistent: they break down very slowly. They also tend to stay inside an animal's body (often in its fat) instead of being passed out in wastes.
- Bioaccumulation: an organism keeps taking in a little bit of the substance every day, and it builds up in its body over its life.
- Biomagnification: each predator eats many prey, and gets the substance from all of them. So the concentration gets higher at each trophic level. Top predators end up with the most.
Remember the energy pyramid? Energy is lost at each level, but these toxins are kept. That's why they pile up at the top.
| Trophic level | Organism (model) | Each one eats... | Units of toxin in each one |
|---|
| Producer | 1 alga | nothing (absorbs it from the water) | 1 |
| Primary consumer | 1 zooplankton | 10 algae | 10 |
| Secondary consumer | 1 minnow | 10 zooplankton | 100 |
| Tertiary consumer | 1 yellow perch | 10 minnows | 1 000 |
| Top predator | 1 osprey | 10 yellow perch | 10 000 |
Real examples from Canada
- DDT and birds of prey: DDT was sprayed to kill insects in the mid-1900s. It biomagnified up food chains to birds such as bald eagles, ospreys and peregrine falcons. It made their eggshells so thin that they broke when the parents sat on them, and these bird populations fell sharply. After Canada and other countries restricted DDT in the 1970s, these birds slowly recovered.
- Mercury in fish: mercury can enter lakes from industry, from burning coal, and from flooded soils behind new dams. Bacteria change it into a form that biomagnifies. Large, older predatory fish like walleye and pike can have the most. Ontario publishes a Guide to Eating Ontario Fish that tells people how much fish from each lake is safe to eat.
- Grassy Narrows and Wabaseemoong: in the 1960s, a chemical plant connected to the paper mill in Dryden, Ontario, released mercury into the English–Wabigoon River system. The mercury built up in fish, an important food and source of jobs for the Anishinaabe communities of Grassy Narrows First Nation and Wabaseemoong Independent Nations. Many people became ill. These communities continue to work today for clean-up, health care and justice.
Worked exampleLet's predict ripple effects in a food web
A lake food web: algae are eaten by zooplankton; zooplankton are eaten by minnows; minnows are eaten by walleye and by loons. A disease kills most of the minnows. Predict the effects on algae, zooplankton, walleye and loons.
- Walleye and loons (predators of minnows) lose a major food. Their numbers may fall, or they may switch to other prey, such as other small fish.
- Zooplankton (eaten by minnows) are eaten less, so their numbers rise.
- Algae (eaten by zooplankton) are eaten more by all those extra zooplankton, so algae may decrease and the water may become clearer.
- Check the pattern: the change went up the chain (predators lose food) and down the chain (prey increase, then their food decreases). Levels alternate: up, down, up...
Walleye and loons decrease (or switch prey); zooplankton increase; algae decrease. A change in one link sends ripples both up and down the web.
Modelling with code
Scientists use computer models to test predictions. Here is a plan for a simple program that models the 10% rule and the effect of a smaller producer level. The program asks for the producers' energy, then uses a loop to pass 10% to each level.
SET energy TO (ask: "Energy stored by producers in kJ?")
SET level TO 1
SAY "Level 1 (producers): " + energy + " kJ"
REPEAT UNTIL level = 4
CHANGE level BY 1
SET energy TO energy × 0.1
SAY "Level " + level + ": " + energy + " kJ"
END REPEAT
IF energy < 50 THEN
SAY "Warning: not enough energy for top predators!"
END IF
Pseudocode for an energy-transfer model. You can build it with blocks in Scratch or another coding app.
Worked exampleLet's trace the code
Run the program in your head. The user types 40 000 kJ. Then run it again with 4 000 kJ (a drought cut the producers by 90%). What does the program say each time?
- Run 1: Level 1: 40 000 kJ. The loop runs: level 2 → 4 000 kJ; level 3 → 400 kJ; level 4 → 40 kJ. Now level = 4, so the loop stops.
- Is 40 < 50? Yes, so it says the warning.
- Run 2: Level 1: 4 000 kJ. Level 2 → 400 kJ; level 3 → 40 kJ; level 4 → 4 kJ. 4 < 50, so it says the warning.
- Compare: cutting the producers to one tenth cut every level to one tenth. The top predators went from 40 kJ to 4 kJ.
Both runs give the warning, and run 2 shows how a drop at the bottom of the chain shrinks every level above it.
Debug like a coder
If the loop said REPEAT UNTIL level = 4 but you forgot CHANGE level BY 1, the level would never reach 4 and the loop would never stop. That's called an infinite loop. Always check that a loop's condition can actually become true.
Just for funA coder's food chain: snacks → programmer → code → bugs → more snacks. Luckily, unlike the 10% rule, debugging gives back more energy than it takes (eventually).
Hands-on activityFood web ripple game
You need: 10 index cards or paper squares, a pencil, a ball of string or yarn, tape.
- Write one organism on each card for a lake: Sun, algae, water plants, zooplankton, mayfly larvae, minnows, crayfish, walleye, loon, river otter.
- Tape the cards on the floor or a wall. Connect each eaten organism to its eater with string. (Minnows eat zooplankton and mayfly larvae; crayfish eat water plants and mayfly larvae; walleye eat minnows and crayfish; loons eat minnows; otters eat crayfish and walleye.)
- Remove one card (for example, the minnows). Gently tug each string that was connected. For each organism, write ↑ (increase), ↓ (decrease) or ? (not sure), and a reason.
- Try removing a producer, then a top predator. Which removal caused the biggest ripple?
- Optional coding: build the energy program above in a block-coding app and test it with different starting numbers.
What to look for: predictions with reasons that go both up and down the web (for example: minnows removed → zooplankton ↑ → algae ↓; loons ↓ or switch prey), and a sensible choice about which removal had the biggest effect (usually a producer).
Your turn
1In the chain grass → hares → lynx, what happens to the hares and the grass if the lynx are removed?
Hares increase at first. Then they overeat the grass, so grass decreases, and later many hares starve.
2What is a trophic cascade?
A ripple effect down a food chain when a top predator is removed or returns, changing the numbers of animals and plants below it.
3Describe the sea otter trophic cascade in two or three sentences.
Sea otters eat sea urchins, which eat kelp. When otters were hunted out, urchins increased and ate the kelp forests. When otters returned, urchins decreased and kelp grew back.
4What is the difference between bioaccumulation and biomagnification?
Bioaccumulation: a toxin builds up inside one organism over its life. Biomagnification: the toxin's concentration increases at each higher trophic level of a food chain.
5Why do persistent toxins pile up at the top of food chains, while energy gets smaller?
Energy is lost as heat at each level, but the toxin is kept in the body. Each predator eats many prey and keeps the toxin from all of them.
6What did DDT do to bald eagles and ospreys?
It made their eggshells thin, so eggs broke and fewer chicks hatched. Their populations fell.
7How did the sea lamprey affect the Great Lakes food web?
It is an invasive fish that feeds on other fish. It helped cause a big drop in lake trout, a top predator fish.
More practice: warm-up
1Which is a keystone species on the Pacific coast?
2Do toxins like mercury become more or less concentrated higher in a food chain?
3Name one persistent toxic substance.
For example DDT, mercury or PCBs.
4What Ontario guide tells people how much fish from a lake is safe to eat?
The Guide to Eating Ontario Fish.
5In the biomagnification model table, how many units of toxin are in one osprey?
More practice: on your own
1Use the model table: if each yellow perch ate 20 minnows instead of 10 (each minnow still has 100 units), how many units would one perch have?
2Why should a pregnant person or a young child eat fewer large predatory fish, like big walleye or pike, than small fish?
Large predatory fish are high in the food chain and older, so they have more mercury from biomagnification. Young, developing bodies are more easily harmed by mercury.
3Trace the code with a starting energy of 900 000 kJ. What does it say for level 4, and does it give the warning?
Level 2: 90 000; level 3: 9 000; level 4: 900 kJ. 900 is not less than 50, so no warning.
4In a food web, a predator eats mice, voles and grasshoppers. Why might removing the mice have only a small effect on the predator?
It can switch to its other prey (voles and grasshoppers). More connections in a web make it more resilient.
5Why did bald eagle and peregrine falcon numbers recover after the 1970s?
Canada and other countries restricted DDT, so less of it entered food chains, eggshells became normal again, and more chicks hatched.
Challenge
1Explain the sea otter story using the words keystone species, trophic cascade, producer and primary consumer.
The sea otter is a keystone species: it eats sea urchins, the primary consumers that graze on kelp, the producer. When otters were removed, urchins exploded and destroyed kelp forests. When otters returned, they controlled urchins and kelp recovered. This chain of effects from the top down is a trophic cascade.
2Why does mercury pollution in a river system cause special harm to communities, like Grassy Narrows First Nation, whose people traditionally eat a lot of local fish?
Mercury biomagnifies, so predatory fish like walleye can have high levels. People who eat a lot of these fish are at the top of the food chain and take in more mercury, which harmed their health. It also harmed their food supply, jobs (such as fishing and guiding) and way of life connected to the river.
3Change the code so it also prints a warning if the producers start with less than 1 000 kJ. Write the new lines and say where they go.
Add right after the first line: IF energy < 1000 THEN SAY "Warning: producers are low!" END IF. It must go before the loop, while energy still holds the producers' value.
Quiz
1. In grass → hares → lynx, if the lynx are removed, the hares will most likely...
2. Sea otters returning to a coast led to...
3. Biomagnification means a toxin...
4. Which organism would likely have the highest concentration of mercury?
5. DDT harmed birds of prey mainly by...
6. A drought cuts the producers in a food chain to half. In general, what happens to the energy available at the top level?
7. Which line of code would cause an infinite loop if it were missing from the energy program?
Big idea: changing one part of a food chain or web sends ripple effects up and down it. Top predators can control whole ecosystems (trophic cascades), and persistent toxins become more concentrated at each higher level (biomagnification).
How to help at home:
- Build the string food web and play "What if?" Ask your child to explain each arrow up or down.
- Look up your nearest lake in Ontario's Guide to Eating Ontario Fish together and talk about why big predatory fish have more advice attached.
- If your child codes, help them build the energy program with blocks and test different numbers.
A note on Grassy Narrows: this lesson mentions the mercury poisoning of the English–Wabigoon River and its effects on Grassy Narrows First Nation and Wabaseemoong Independent Nations. It is a real and ongoing harm to living communities. Talk about it respectfully, and focus on how it shows why protecting water and food chains matters for people's health.
Common difficulties:
- Predicting only one effect, instead of following changes both up and down the web.
- Mixing up bioaccumulation (within one organism) and biomagnification (across levels).
- Thinking toxins get smaller up the chain like energy does.